Free Chrome Extension
Google Search Console,
the way it should be
Hourly data, week-over-week charts, deep URL filtering.
Hourly data, week-over-week charts, deep URL filtering.
The standard Search Console interface caps data at daily granularity. This extension surfaces everything hidden underneath.
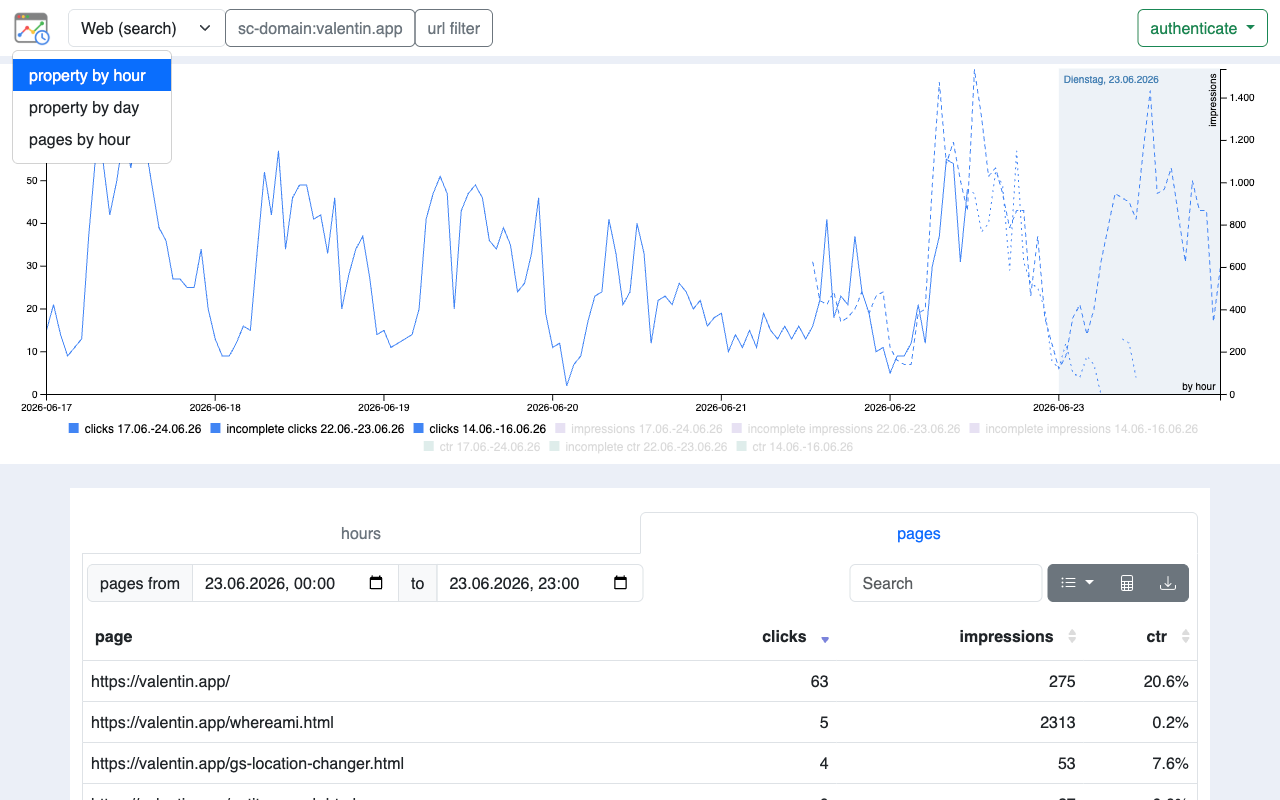
See clicks and impressions broken down by hour — not just by day. Spot traffic spikes, indexing events, and algorithm changes within hours, not days.
A dual-axis Billboard.js chart overlays the last 7 days against the previous 7-day period for instant comparison. Incomplete hours are visually flagged.
Six filter operators: contains, not contains, exact, not exact, regex match, regex exclude. Encode any filter into a shareable URL.
Define a regex to extract IDs from URLs. Multiple URLs with the same ID (e.g. product variants) collapse into a single row with aggregated metrics.
Copy visible table data as tab-separated values with one click — paste directly into Google Sheets. Also supports CSV export.
Every filter, property, date range, and search type is encoded in the URL. Bookmark a view or share it with a teammate and they see exactly the same data.
The main chart shows the most recent 7 days of hourly data overlaid against the preceding 7-day period — so you can instantly see whether today is tracking above or below last week.
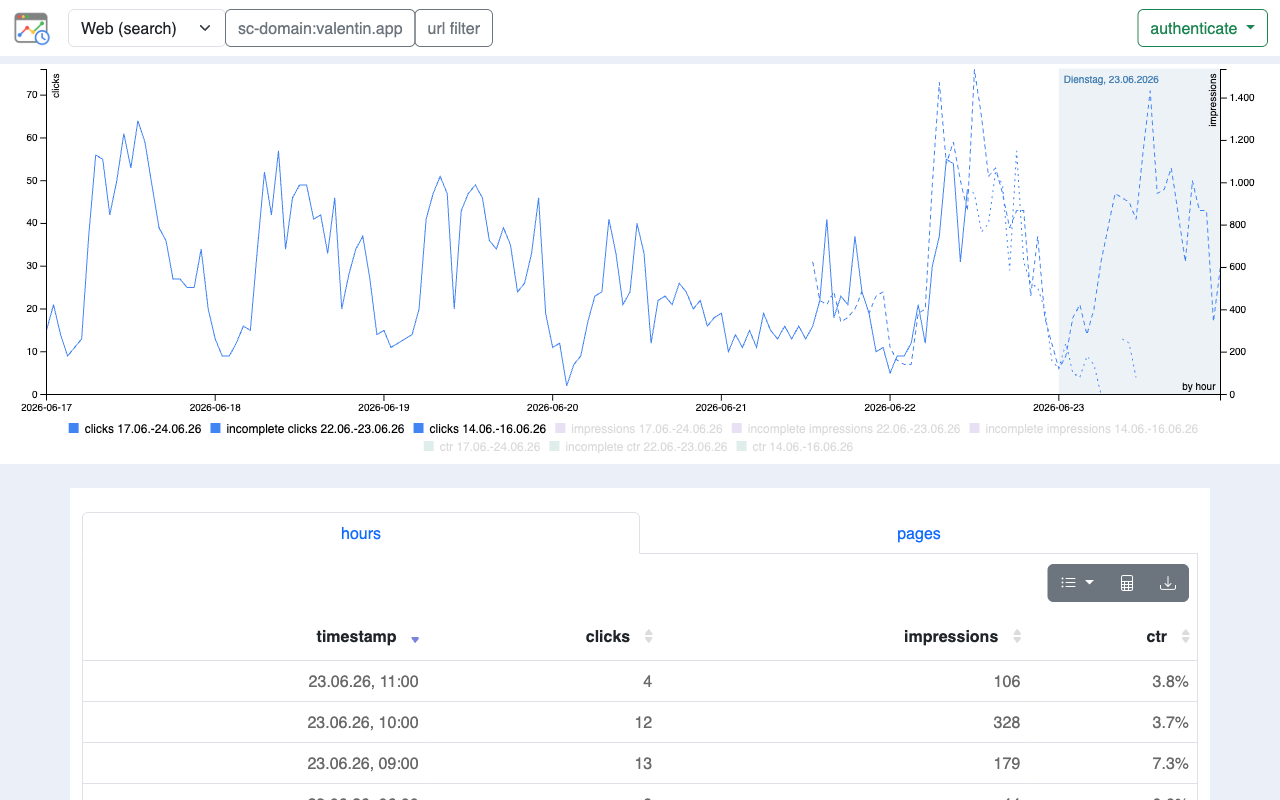
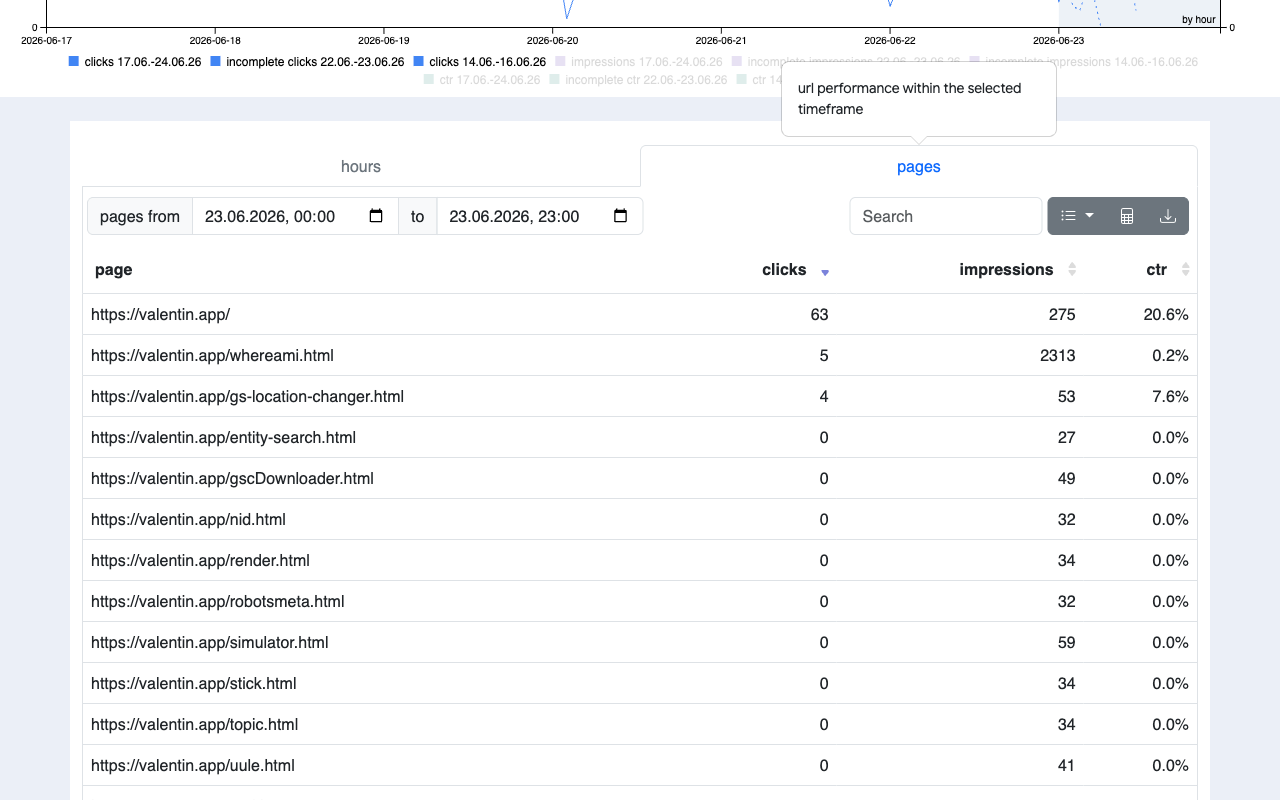
The Pages tab shows aggregated clicks, impressions, and CTR per URL for any time window you define — down to the hour. Sort, search, and drill into any URL.
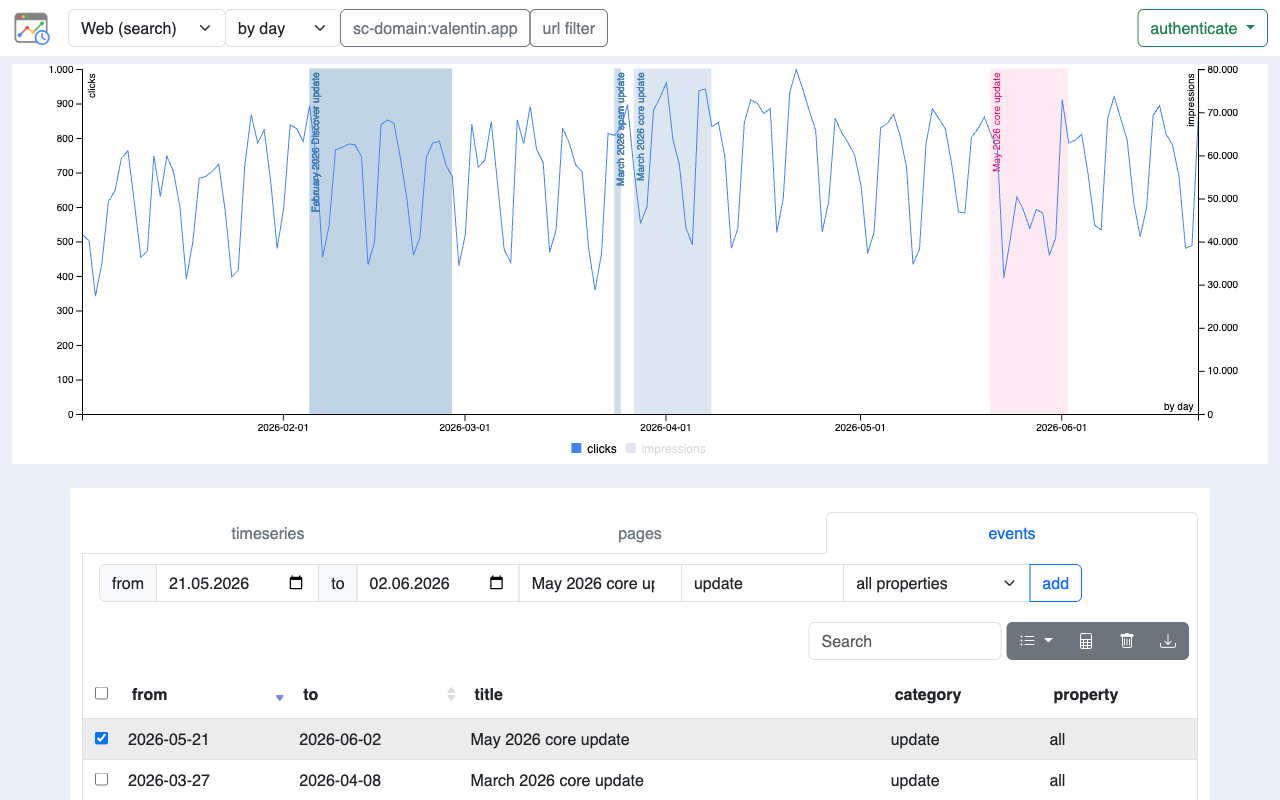
Switch to the Days view for monthly or daily trend analysis across your entire data history. Toggle between month and day granularity depending on the timeframe you need.
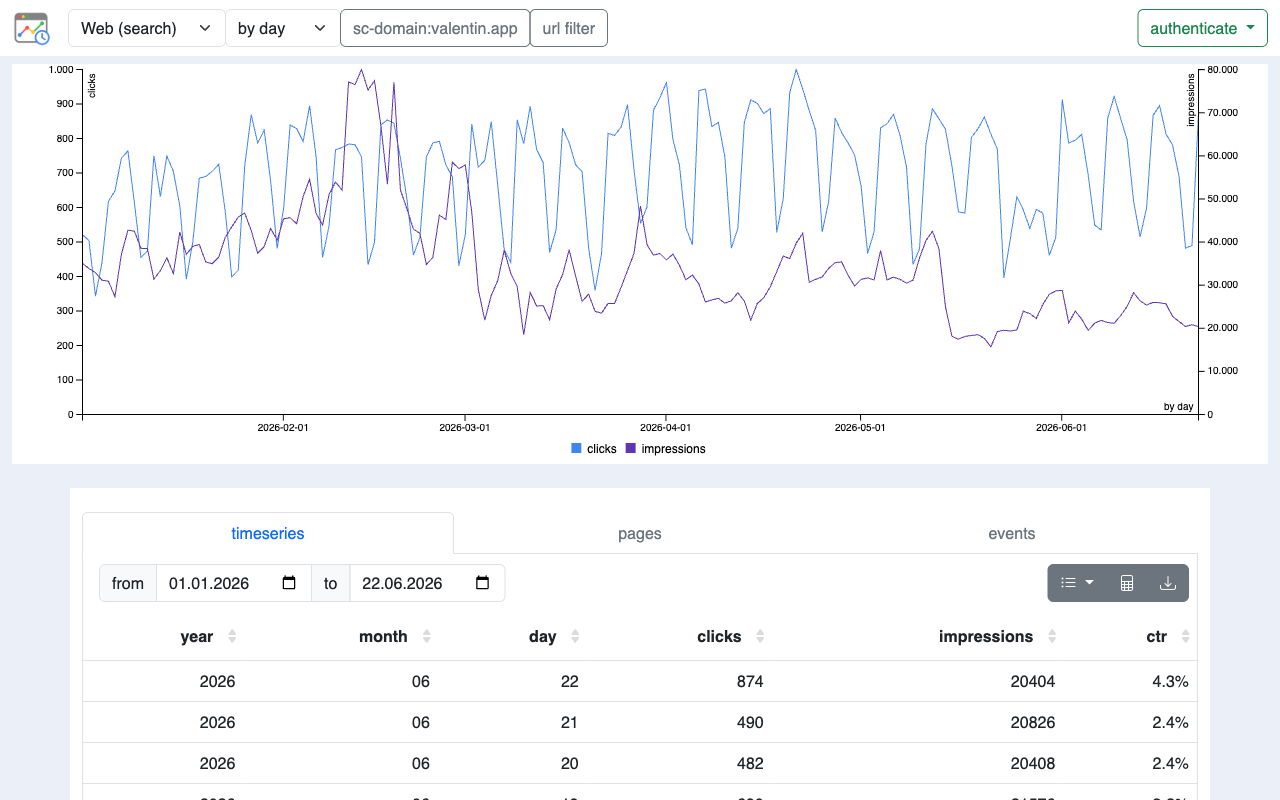
The Days view includes a built-in events system. Mark deploys, algorithm updates, content changes, or anything else directly on the chart so you can correlate traffic shifts with what actually happened.
Free. No account. No server. Your data goes directly from Google to your browser.
Add to Chrome — it's free